Ryan Fitzgerald
Portfolio
Case Studies

Data Utilization
Business Problem:
Limited visibility into storage usage across production phases leads to inefficient forecasting, over-purchasing, resource shortages, and misaligned budgets.
Solution:
Developed dashboards for comprehensive lifecycle visibility, enabling precise forecasting, proactive resource allocation, and identification of bottlenecks to optimize usage and align budgets with project demands.
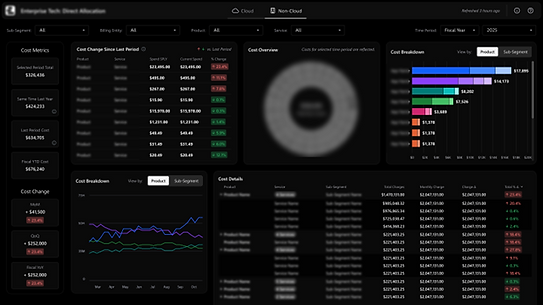
Expenditure Analysis
Business Problem:
Lack of visibility into costs across different business segments, leading to challenges in identifying high-cost areas, budget management opportunities, or quality spend inefficiencies.
Solution:
Designed tools exposing hidden expenses and misconfigurations that were driving up costs, improved budgeting and forecasting by identifying long-term cost trends, and facilitated the company to plan resources more effectively/reduce unnecessary expenditures.


Price Elasticity
Business Problem:
Limited insights into competitive pricing, customer behavior drivers, and underutilized POS data hinder actionable analytics and strategic decision-making.
Solution:
Created an interactive dashboard for price elasticity analysis, What-If simulations, and detailed visualizations of pricing dynamics, enabling optimal pricing strategies and enhanced market share understanding.
Executive Summary
Business Problem:
Manual data handling, lack of automated report refreshes, and a disorganized dashboard made reporting inefficient and unclear.
Solution:
Developed an automated, refreshable dashboard connected to Snowflake, with department-specific pages and role-based views using RLS, offering intuitive, cohesive reports for KPIs, trends, and project insights.


Revenue Growth
Business Problem:
Disconnected reports, inconsistent metrics, and limited flexibility hinder centralized insights, adaptation to new KPIs, and quick decision-making.
Solution:
Created a cohesive dashboard with top-down analysis, connected disparate data sources, automated reporting through Power BI Services, and introduced targeted KPIs to enhance performance tracking and decision-making
Trade Investment Mgmt
Business Problem:
Inability to access trade spend and ROI data across multiple dimensions, limiting analysis of promotional effectiveness. No insights into spend efficacy by type and sub-type, making it.
Solution:
Created a “Gross to Net” walk in a P&L-style format, providing clear visibility into the impact of trade spend on net sales, allowing users to easily compare performance across spend types, highlighting the most effective investments.
Empowered business users to negotiate better promotion rates with customers by unlocking insights into spend performance.


Working With the Best Companies


